Trade & Markets
Right About the Wrong Sector
Twenty-five years of trade assistance, worth about three and a half years of the preference it supported, was built on the idea that African exporters could not claim it. In apparel, which was 60% of what AGOA was worth, we were already claiming almost all of it.
The finding, in sixty seconds
- The standard explanation for AGOA’s record is that African firms could not claim the preference, and about most of the schedule it is right. About apparel, it is wrong, for the six economies out of thirty-two that have an apparel industry. Those six hold about two thirds of the value AGOA ever delivered. Lesotho paid 0.13% duty on garments in 2024. Vietnam, with no preference, paid 18.39%.
- That makes the next fact harder rather than easier. Lesotho claimed it perfectly, and its exports still fell 53% from 2018 to 2024, while Ghana’s rose 181% on the identical preference.
- The three economies that have actually lost AGOA show what it is worth by its absence. The duty changes overnight. The trade takes years. Coming back takes longer than leaving.
Lesotho built a garment industry on a rule that guaranteed it would never take root.
There is a standard account of why AGOA underdelivered, and it isn’t a straw man. The Congressional Research Service puts it to Congress in as many words: the programme “may be underutilized due to beneficiary countries’ inability to take advantage of AGOA benefits”.
On that account our rules of origin, the paperwork proving where a garment was really made, are too complex. Our customs administrations are under-resourced. Our firms are too small to certify compliance even when they know the preference is there.
The response followed from the diagnosis. USAID has put about $1.6 billion into AGOA-related trade capacity building since 2001, delivered through regional hubs opened in Gaborone, Nairobi and Accra from 2002 and renamed through several generations since: Global Competitiveness Hubs, then Trade Hubs, then Trade and Investment Hubs. The names changed. The premise did not.
That sounds enormous until you set it beside the thing it was supporting. AGOA keeps roughly $450 million of duty off American import bills in a single year, which the American importer would otherwise have paid. The whole twenty-five-year assistance budget is worth about three and a half years of the preference itself.
Those programmes did a great deal of good on what they had, and I am not here to diminish it. On most of the tariff schedule the diagnosis they worked from was right, and I will come to that.
I should declare an interest, because I am not writing about this from outside it. I was one of the people who worked on these programmes. The premise I am about to take apart is the one I worked under.
The hubs worked several sectors at once. In East Africa, textiles and apparel ran alongside footwear, cut flowers, home decor and speciality foods. In Botswana, the priorities were crafts, jewellery, indigenous products and meat. Apparel was always on the list and was never the whole of it, and that distinction matters more than anything else here.
The diagnosis is testable, and until recently I never bothered to test it. The margin a tariff line makes available is easy to measure. Whether an exporter actually claimed it is a different quantity. Economists call that utilisation, and underneath the word is a plain question: did the exporter use the discount, or pay full price anyway? I marked it as the largest gap in the data.
What we actually paid
United States customs officers calculate a duty on every shipment that enters the country, and the Census Bureau publishes what was assessed. Set that against what the goods were worth, and you get the effective duty: the rate an exporter actually paid at the border, after every discount actually claimed. No estimation is involved anywhere. This is what was collected, counted.
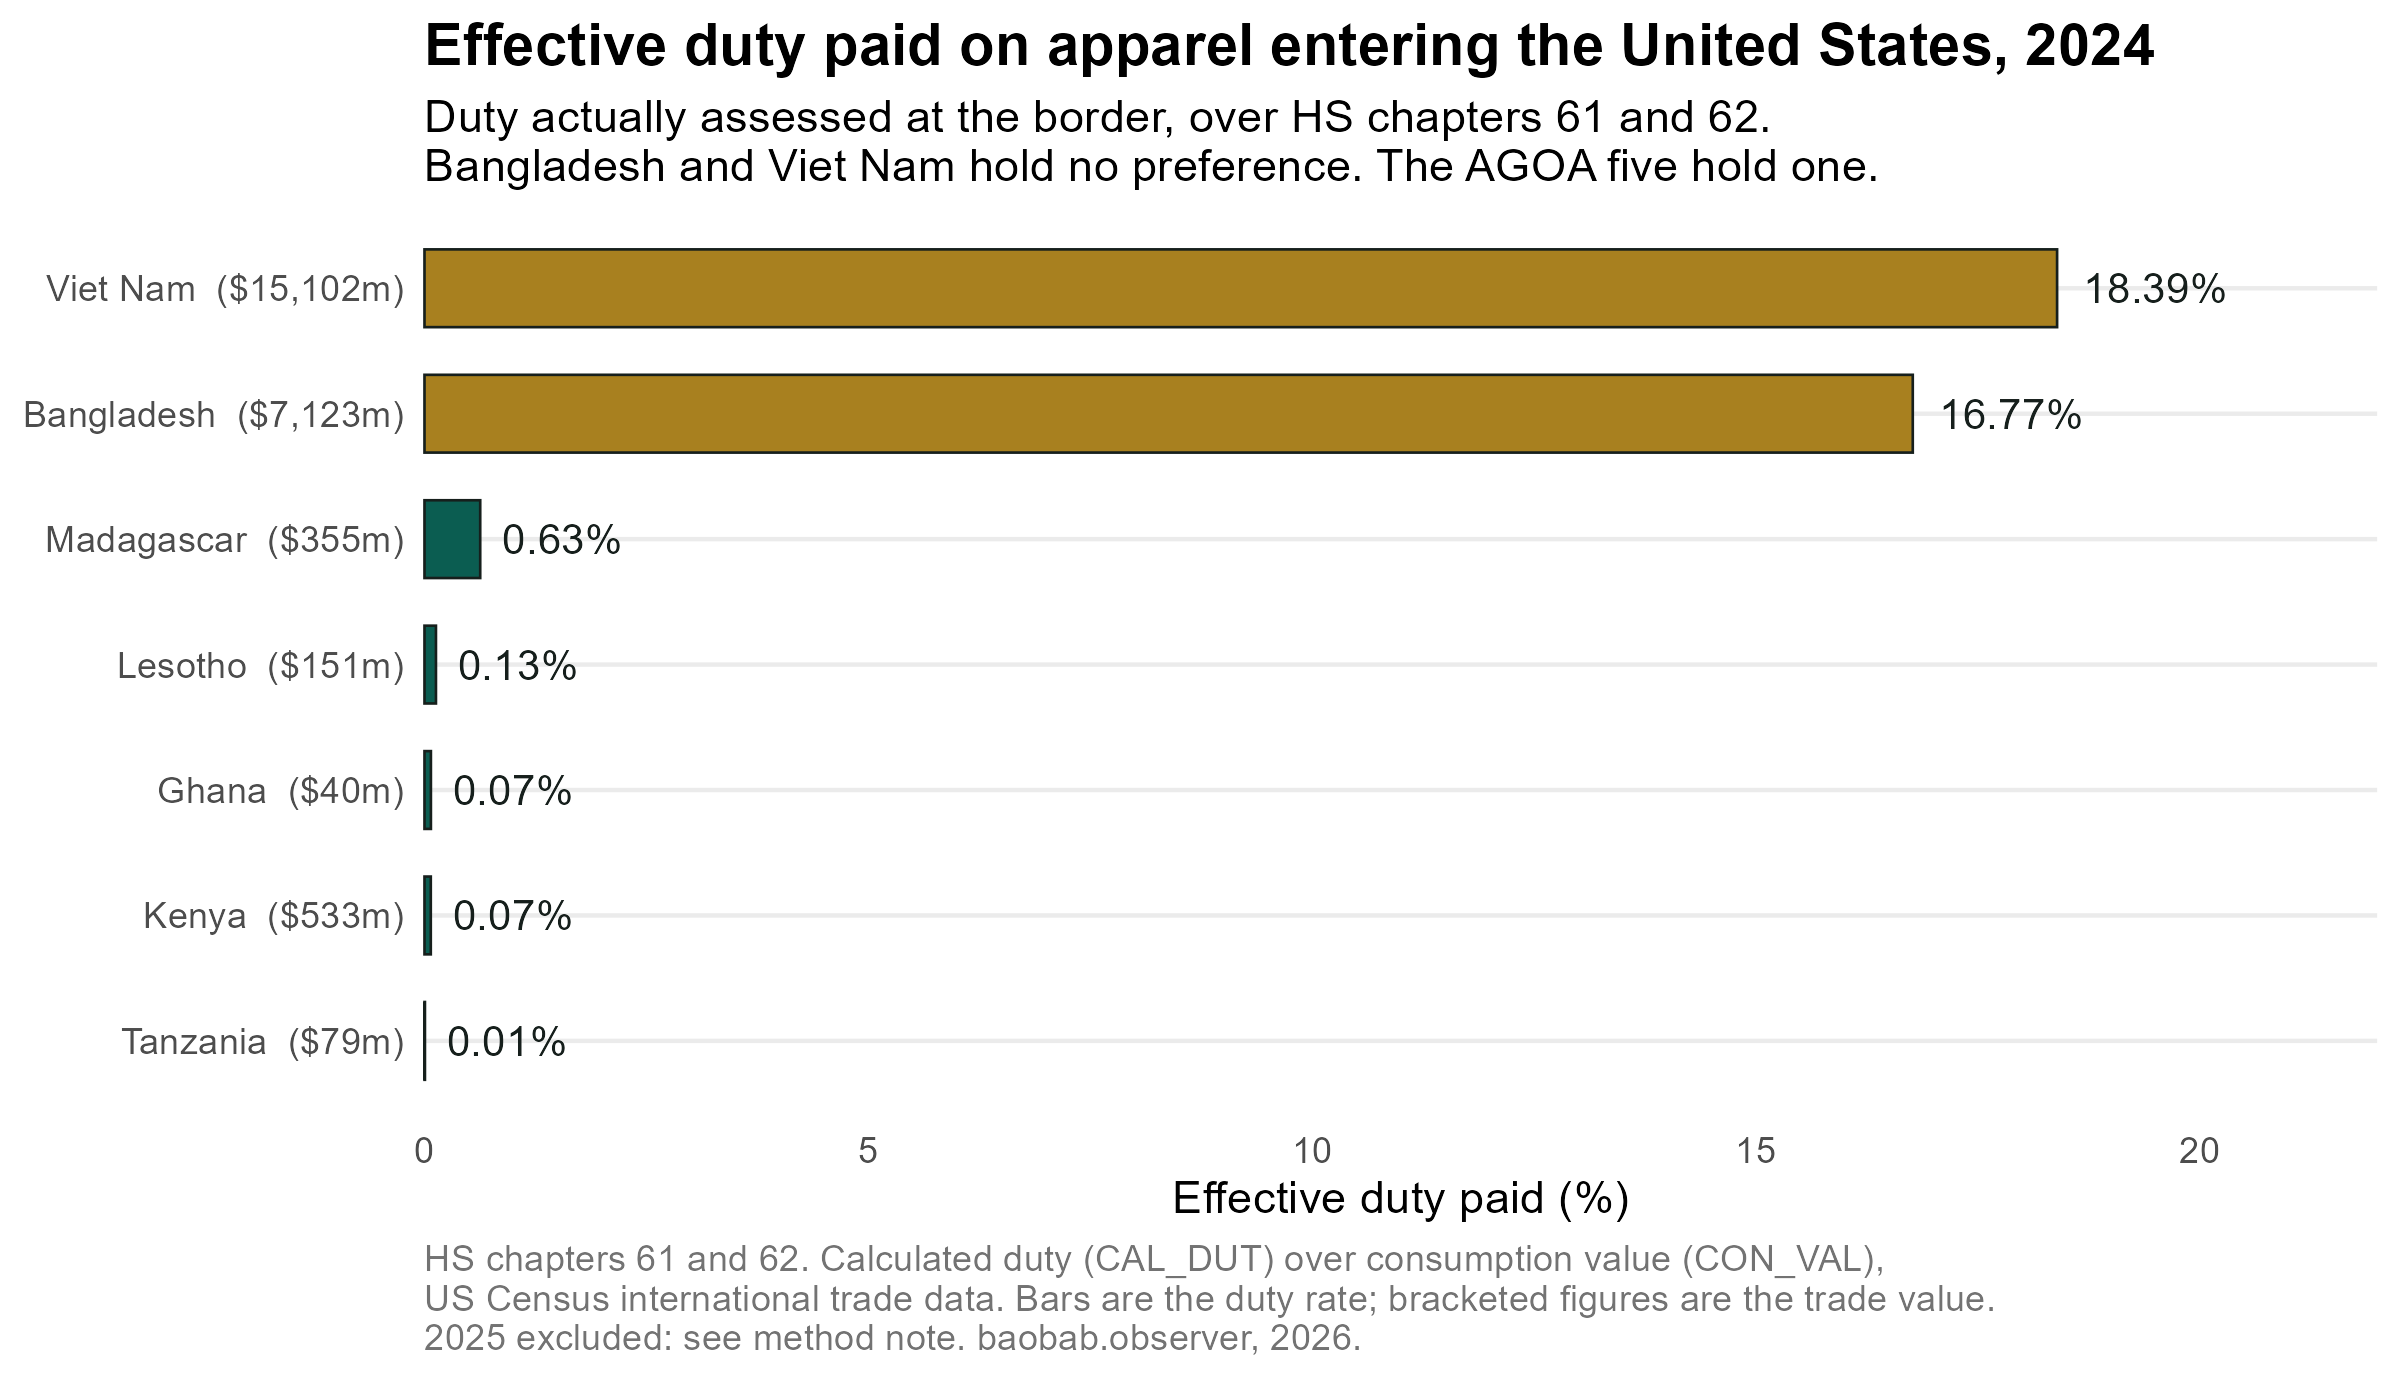
Eighteen percentage points of preference were available, and roughly eighteen were claimed. Across the seven years to 2024, not one of the poorer AGOA countries in this group paid more than 0.30% in any year.
Does that settle it? Not quite. A low rate could in principle come from a country exporting only what was duty-free anyway, which is why this covers chapters 61 and 62 only. Apparel is where the tariff bites. The ordinary rate, the one paid by anyone without a deal, is what trade lawyers call the most-favoured-nation rate. On garments the median is 11.3%, rising to 32%. A country shipping garments at 0.13% has claimed the preference on the lines where claiming it was worth the paperwork.
There is a reason it was so easy to claim.
AGOA’s special rule for apparel lets a beneficiary import fabric from anywhere, cut it, sew it, and ship the garment duty-free. No regional cloth, no local yarn, no upstream supplier to document. It is open only to AGOA beneficiaries with per capita GNP below $1,500 in 1998, plus any country Congress later adds by statute, and every AGOA country holds it except South Africa and Gabon, which was put back on the beneficiary list in 2026 and ships no clothing.
South Africa is the one AGOA country with a substantial domestic textile industry, and the only one barred from the waiver. Its apparel exports to the United States in 2024 were $7.55 million, about one seventieth of Kenya’s $533 million. A provision written to help African exporters made it cheaper for us to buy cloth from Asia than from each other.
The waiver is why Lesotho had a garment industry at all. A country with no textile industry of its own could put fifty thousand people into cut-and-sew work, because the rule said the cloth could come from anywhere. Utilisation was near-perfect because the waiver had removed almost everything there was to fail at.
And it’s why the industry left. A plant that buys its cloth from Asia has no supplier to be anchored to and nothing on the ground but machines and a lease.
There is a mill in Lesotho, and it sharpens the point rather than breaking it. Formosa Textile spins and weaves denim in Maseru, and it belongs to Nien Hsing, built to supply Nien Hsing’s own jeans plants. The upstream that exists is captive to the same foreign owner as the downstream, which is not the same thing as a country having a textile industry.
The rule that made Lesotho possible is the rule that let Nien Hsing, Lesotho’s largest garment employer, close three of its five factories from 2022.
The real limit on the claim is the sample. This measures apparel, in economies that had already built apparel industries. It says nothing about a Zambian firm entering a sector for the first time, or about cut flowers, crafts, or processed food. Those are precisely the lines where take-up support is most plausibly doing work, and they are most of the schedule.
The countries with nothing to claim
The hubs were asking a different question. Not why Lesotho was failing to claim its preference, because Lesotho was claiming it almost perfectly, but why so many others held the same duty-free access for twenty-five years and never built anything to use it with.
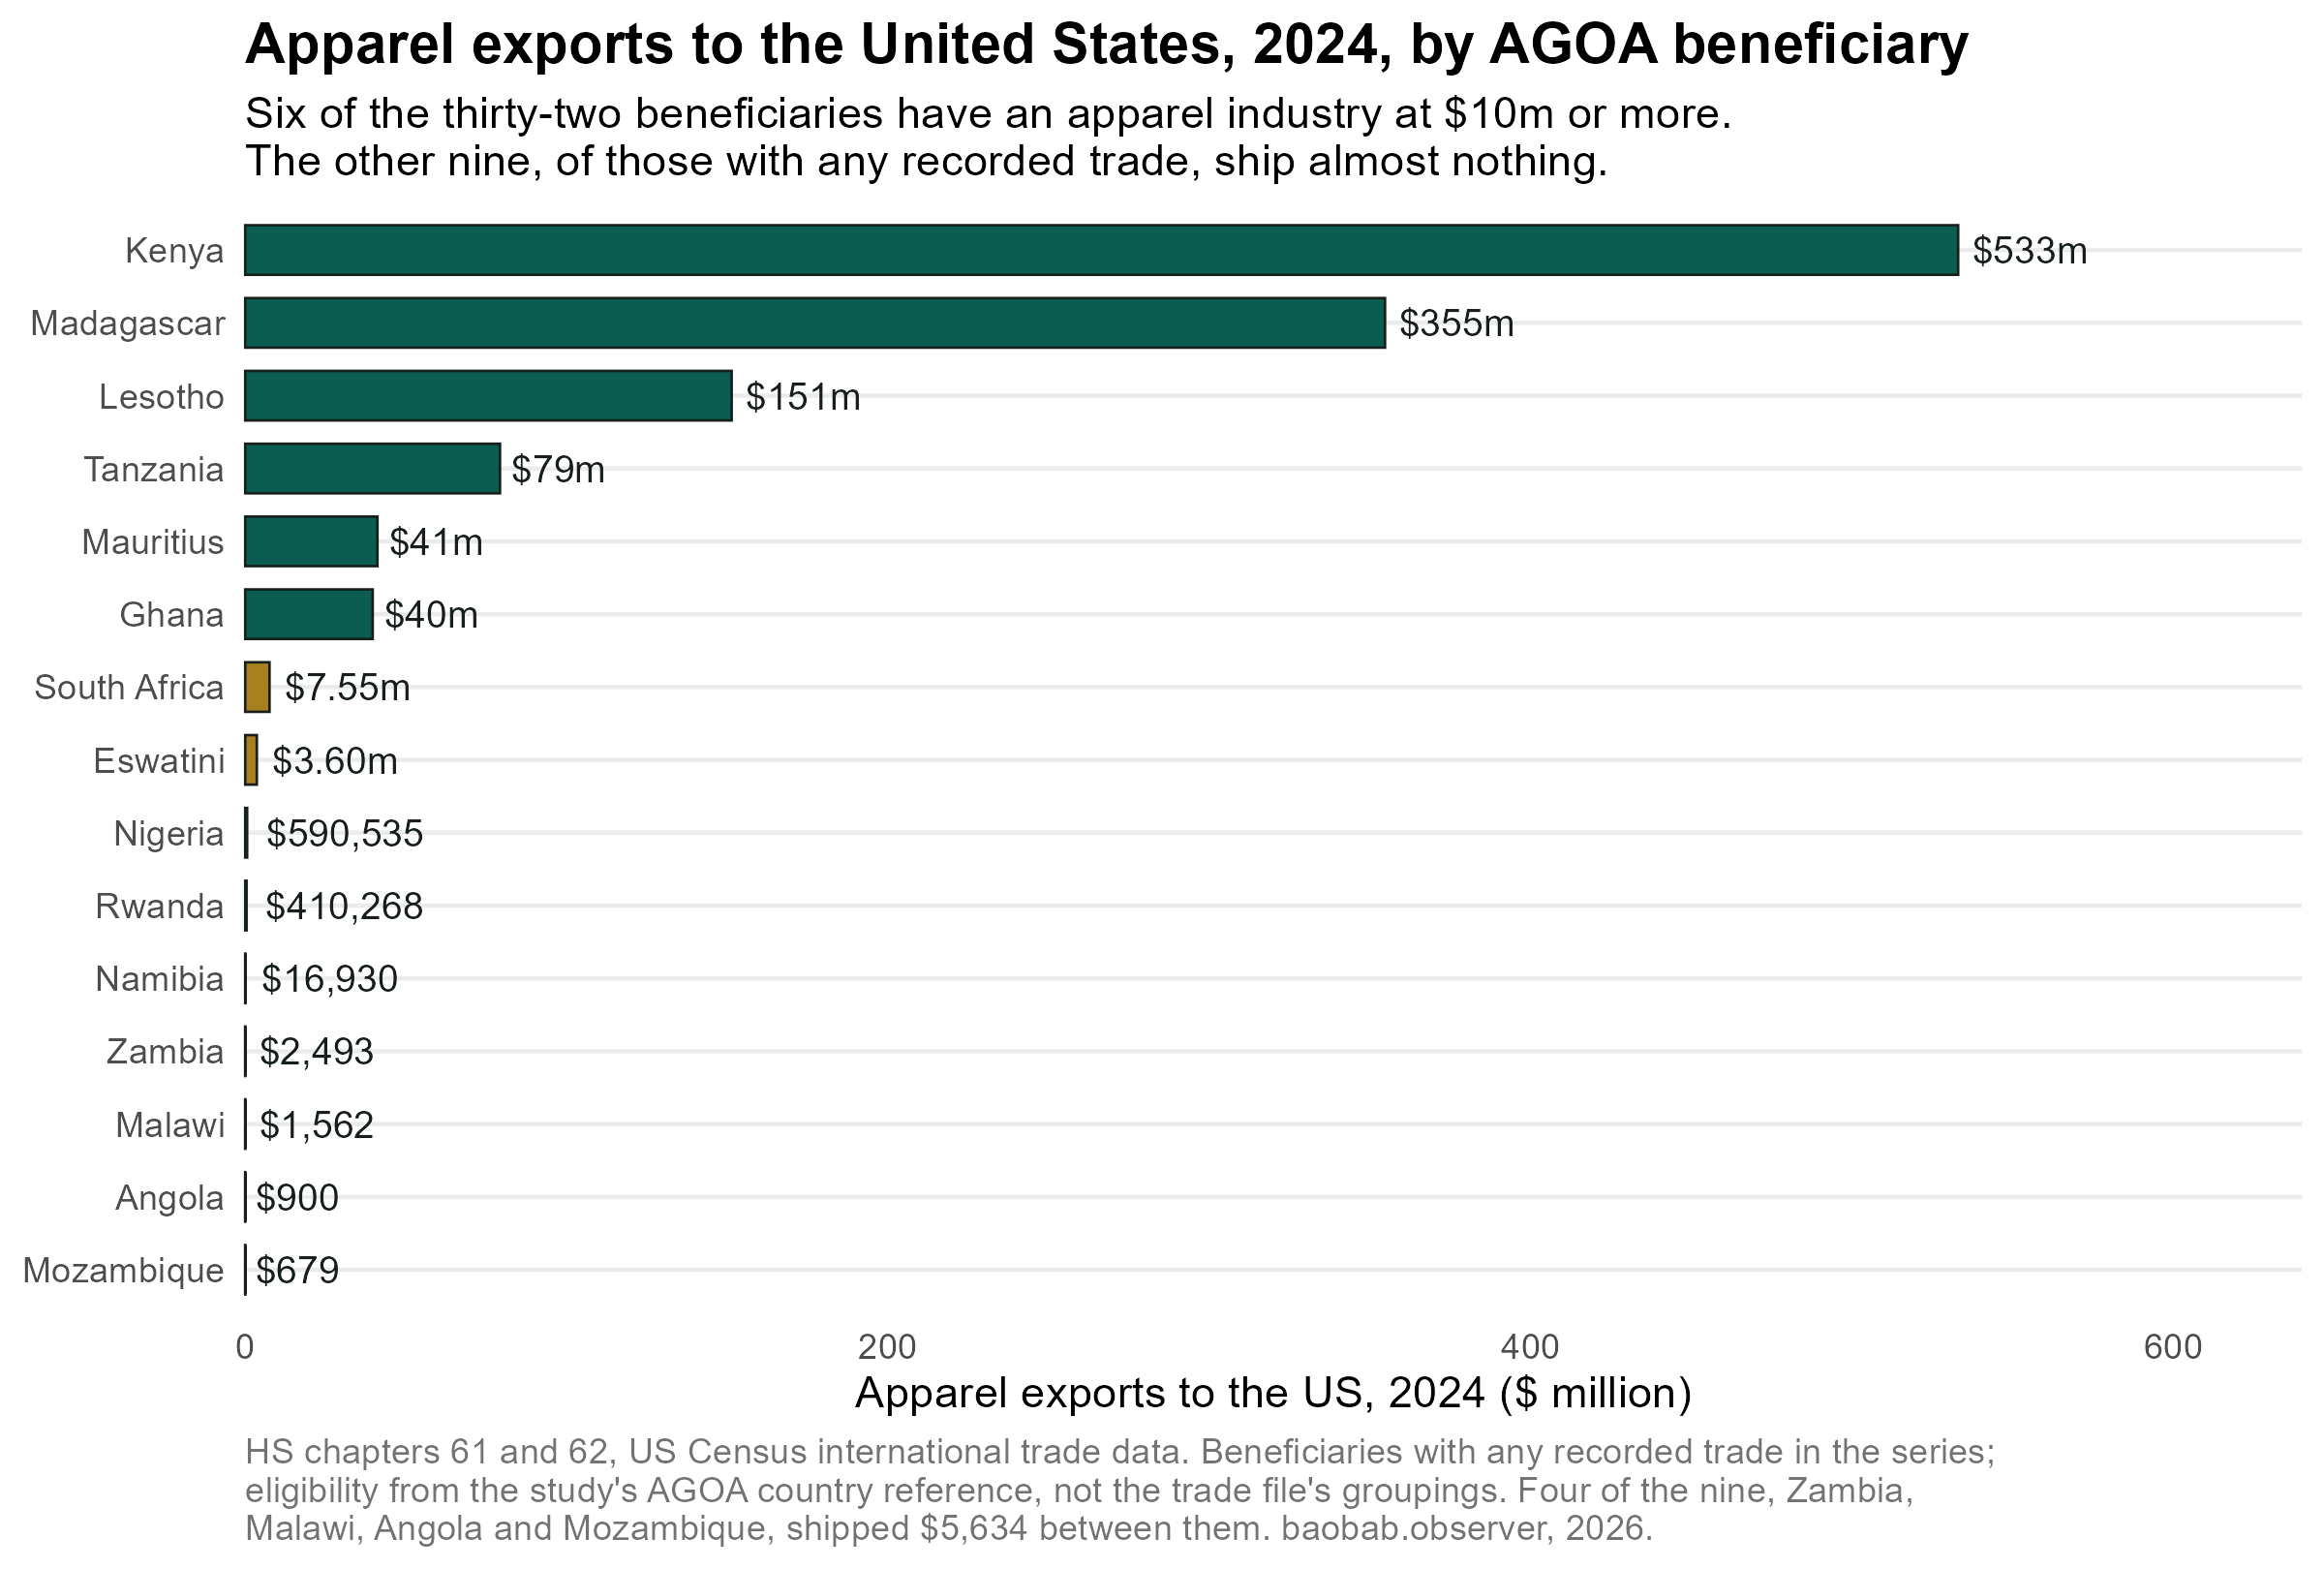
Six economies have an apparel industry worth the name. Nine ship almost nothing. Four of those, Zambia, Malawi, Angola and Mozambique, shipped $5,634 between them in 2024.
You cannot raise a country’s utilisation rate with no factories. No form is being filled in wrongly in Lusaka, no customs officer is misapplying a rule of origin, no exporter is unaware of the programme. There is no exporter.
Utilisation is not the variable here. Having an industry is, and that is a much harder thing to fund than a workshop. Where an industry exists the preference is claimed in full, so there is no take-up left to assist; where none exists there is nothing to claim. Neither case is about paperwork.
The duty stayed flat. The industry halved.
Lesotho’s effective duty on apparel in 2018 was 0.10%. In 2024 it was 0.13%. Between those dates, its apparel exports to the United States fell from $320.7 million to $151.4 million.
The preference worked perfectly and the industry left anyway. How does that happen?
And it isn’t only the trade figures saying so. The Lesotho National Development Corporation, which tracks employment in the firms it assists, counts 34,151 garment jobs in 2024, roughly 16,000 fewer than six years earlier. Two independent measurements, one American and administrative, one Basotho, describe the same decline.
The obvious next thought is that African garment exports to America were declining generally. They weren’t.
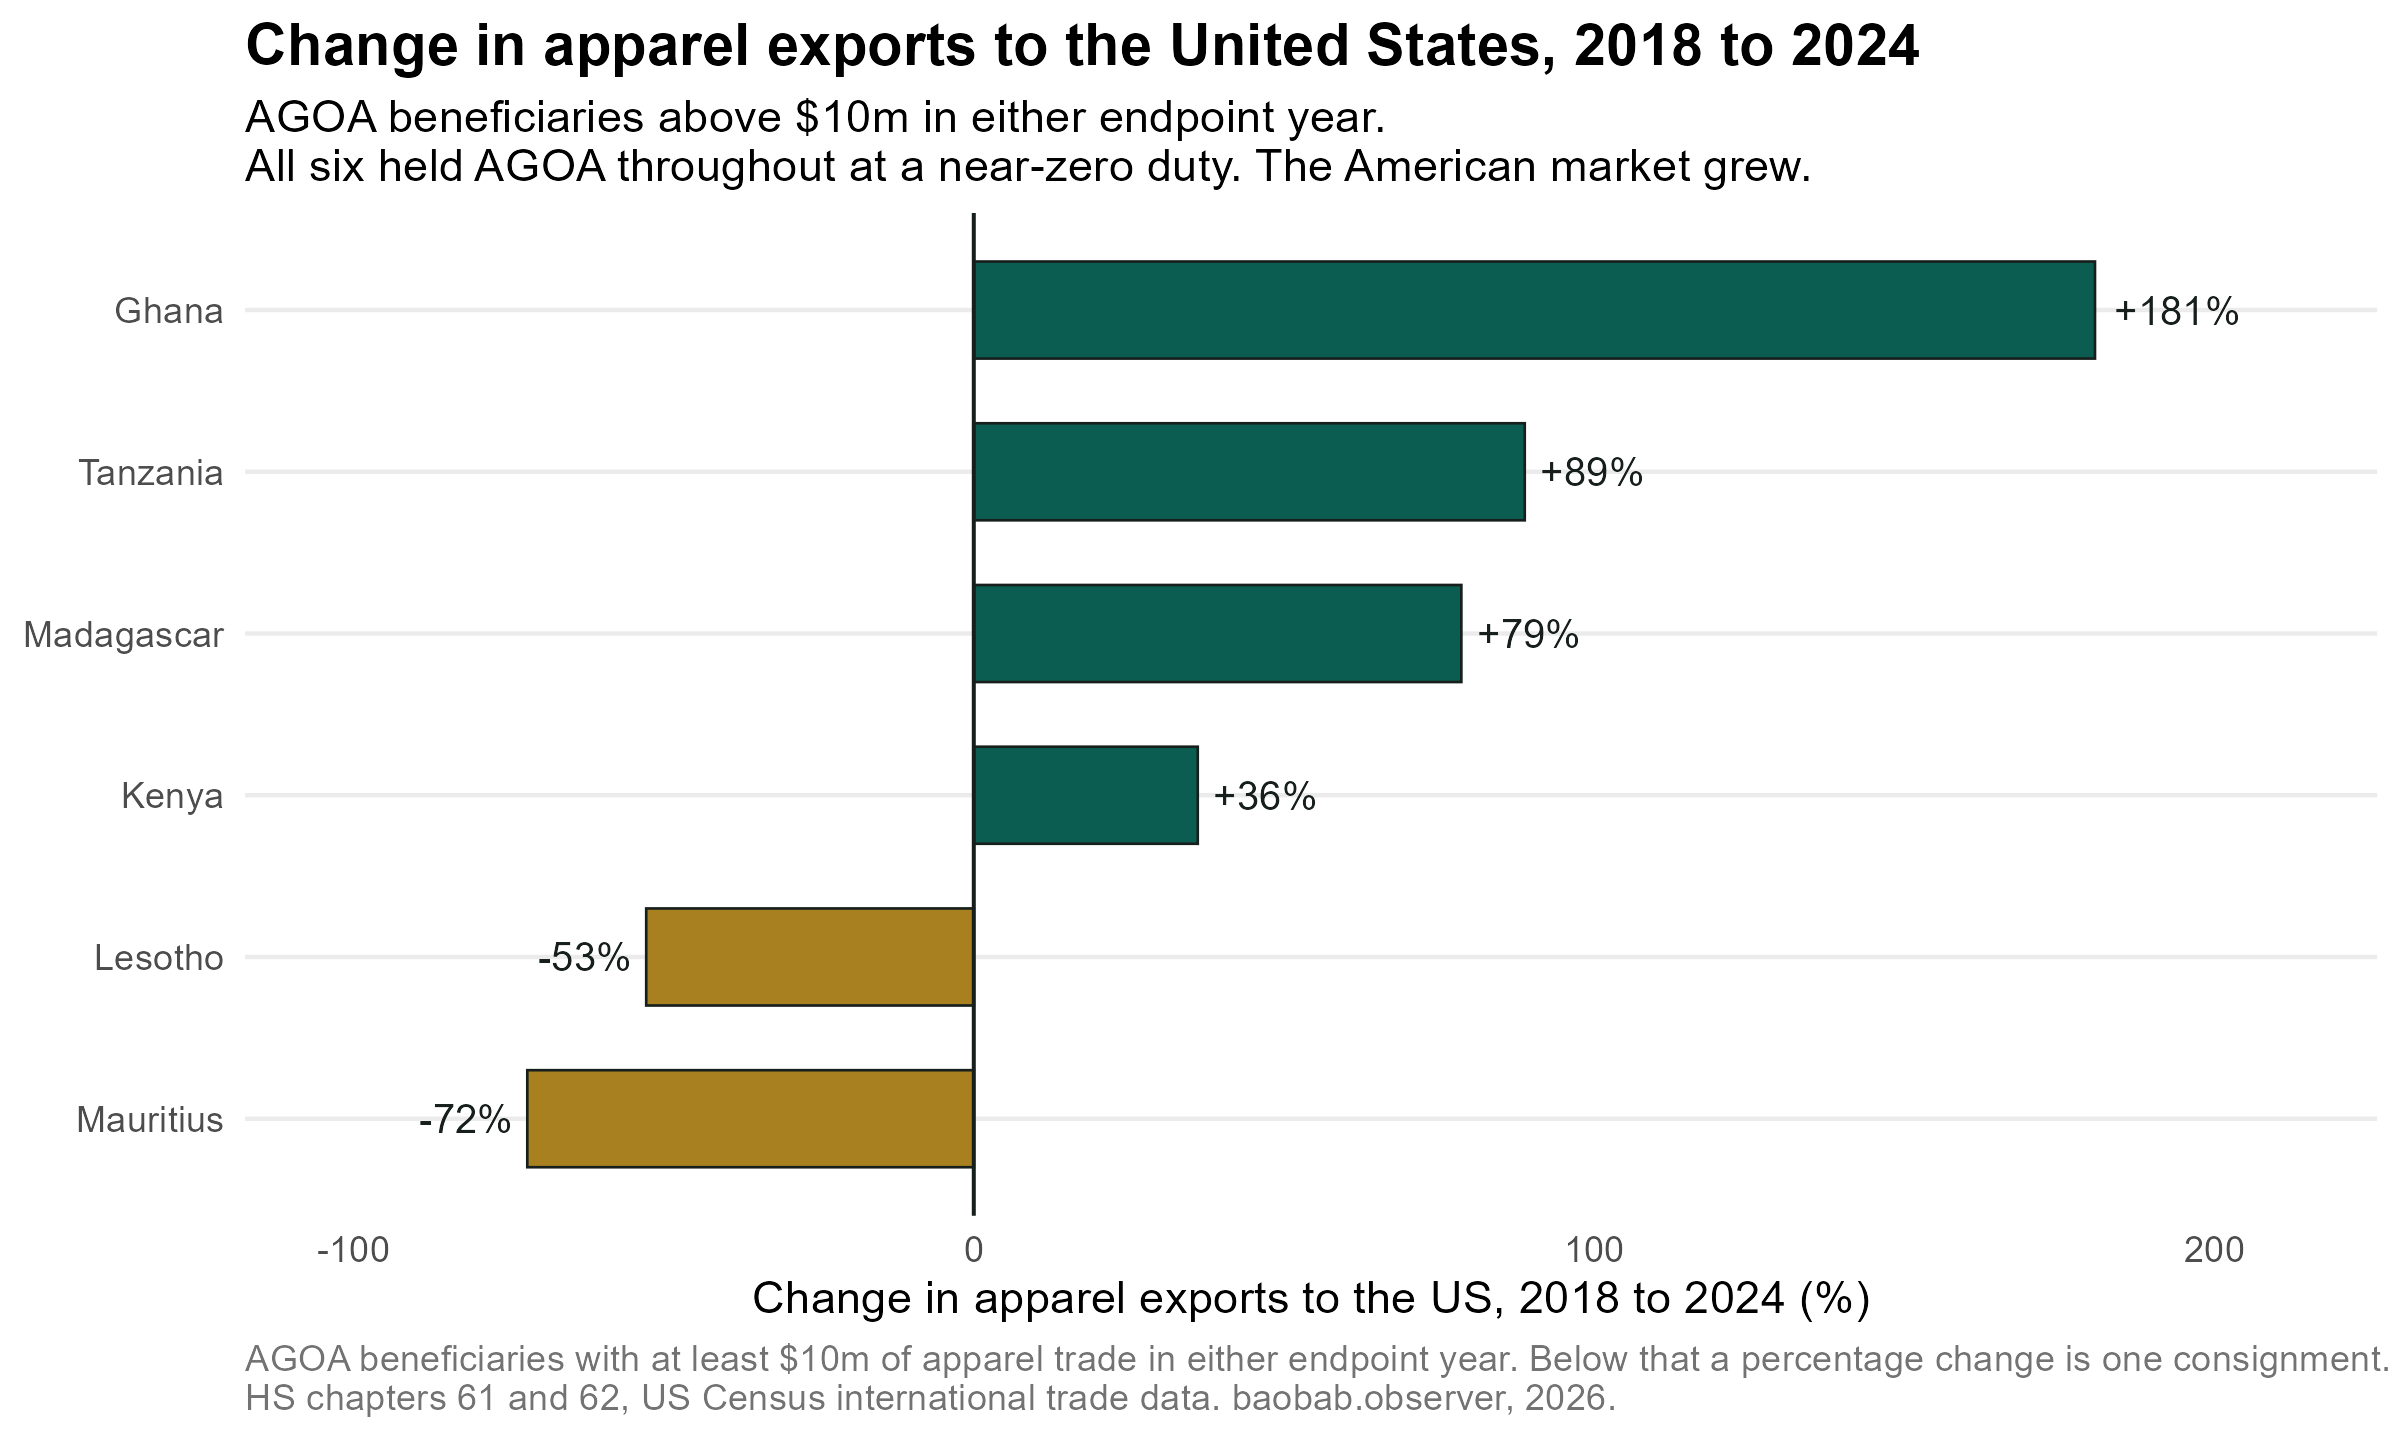
I’m not going to tell you why with any confidence, because this data can’t establish it and this series has already retracted one finding that outran its evidence. What I can say is what its shape rules out. It wasn’t the preference, which all six held and all six claimed. It wasn’t the American market, which grew.
I can account for Mauritius, and will in a moment. Lesotho resists explanation, and two candidates fit. The first is the one the waiver built: foreign-owned, mobile factories rather than an industry, held down by nothing but a lease.
The second fits the timing better. AGOA was legislated to expire in September 2025, so a buyer placing orders in 2022 for delivery two years out was placing them against a preference with a visible end date and no renewal in hand. The rational response is to move the order somewhere the tariff is known.
On this reading Lesotho’s decline is not a response to losing the preference but to the possibility of losing it, arriving years early, in a country whose plants can be relocated from Taipei.
The two that worked, which nobody writes about
I have spent this essay on the country that failed. Is that the right emphasis? The numbers say it isn’t. Kenya and Madagascar account for 44.6% of everything AGOA is worth. Lesotho is 7.3%. The two largest are the least discussed, including here, and they did what the programme was supposed to produce.
Kenya is the single largest, and its exporters save $115.8 million a year. More telling than the growth is the recovery: the 2023 destocking hit Kenya less hard than anyone else in the sample, and it came back 27% to $599 million by 2025, the highest in its history.
Madagascar is the more remarkable of the two, because it has already been through the worst case. It lost AGOA entirely from 2010 to 2014, and its exports fell to $20 million. It is now at $398 million.
One part of the divergence I can evidence, and I am late to it. Madagascar’s rise and Mauritius’ decline are largely driven by one event. The two series move against each other at a correlation of minus 0.88 across sixteen years.
The relocation behind that is documented rather than inferred: Mauritian firms are the largest single group of foreign investors in Madagascar’s apparel industry, at 42%. Treating the two as separate observations, which I did at first, gets the maths wrong.
I can’t answer why Kenya holds up better than Lesotho from customs data, and I don’t have to. Morris and Staritz have studied these countries directly, and they point to ownership and local embeddedness rather than size or geography.
That literature also cuts against the comparison I have been drawing. It groups Kenya with Lesotho and Eswatini, and treats Madagascar as the genuinely different case. If they are right, the sharper contrast is Madagascar against both.
Either way, they establish what the next section makes unavoidable: whatever separated them from Lesotho wasn’t preference. All three held the same one.
What it is worth, measured by taking it away
Three African economies have lost AGOA outright, on dates I can verify against the proclamations. For those three the collected duty shows the loss as an accounting fact rather than an estimated effect.
A rise or a fall tells you little on its own, because the whole apparel market moves together. So everything below is measured against the five big Asian suppliers that never held AGOA and pay the ordinary tariff throughout. The method note says how.
That correction matters immediately.
Ethiopia was removed with effect from 1 January 2022. Effective duty was 0.20% in 2021 and 18.77% in 2022: no inference, no counterfactual, no standard error. The tariff simply arrived.
Its exports then rose, to $344.7 million from $258.8 million. I first read that as orders placed under one tariff regime shipping under the next, and on its own it doesn’t support that. 2022 was a restocking boom, and the median never-AGOA supplier grew 24%. Bangladesh, with nothing to lose, grew 33%.
What survives the correction is smaller and better. Ethiopia grew 33% too, nine points above the market, in the year an eighteen-point tariff landed on it. You do not beat the market in the year your costs jump unless the goods were already committed.
Then the lag ended. $217.6 million in 2023, $161.6 million in 2024, finishing forty points below the market. Surveys of Ethiopian firms fill in what the customs data can’t see. Among AGOA-using firms, 63% reported falling exports and 39% laid off workers.
Eswatini was removed with effect from 1 January 2015. Effective duty rose from 0.04% to 17.66%, and exports fell from $55.0 million in 2014 to $2.6 million in 2015, a 95% collapse in twelve months. Eswatini later regained eligibility and its rate returned to near zero. Its exports did not: $3.6 million in 2024, down from $55 million before the removal.
Madagascar was removed from the beginning of 2010 and reinstated in June 2014. It is the only case in the record that runs in both directions, and the two directions are not symmetrical. It took five years of restored eligibility to exceed where it had been.
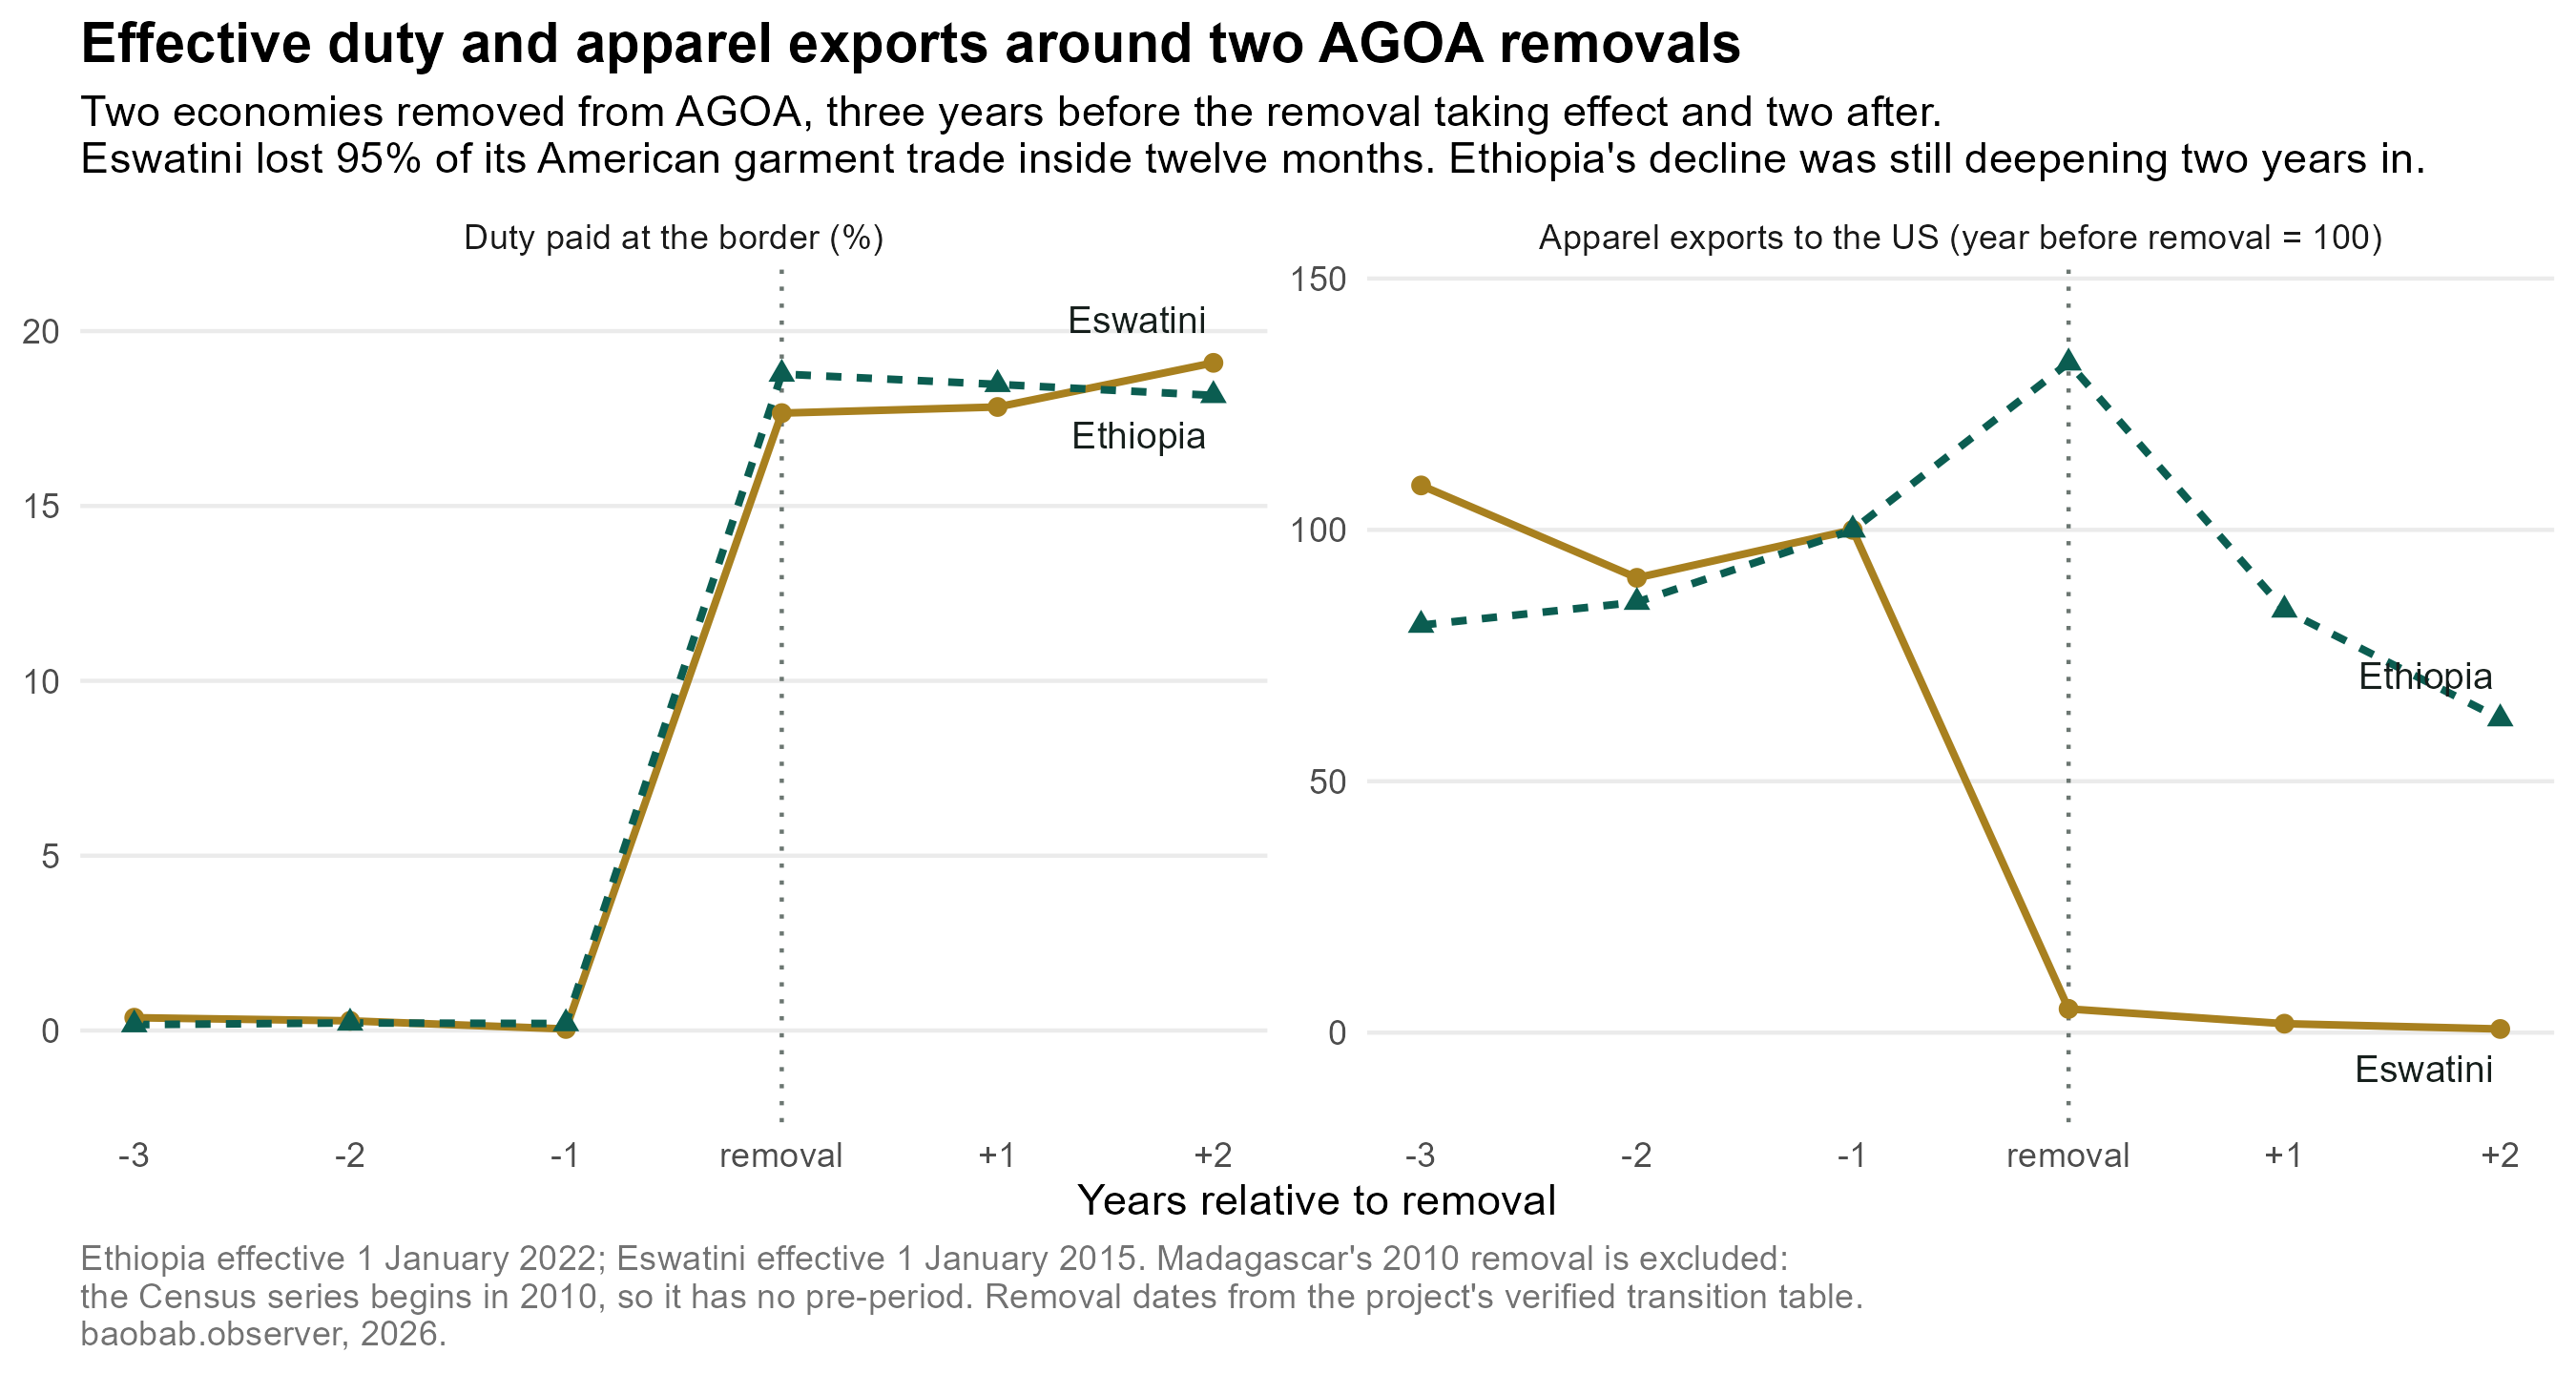
Set them side by side. The duty changes overnight. The trade takes years. And coming back takes longer than leaving.
But the comparison that should worry anyone defending this programme is not between the countries that lost it.
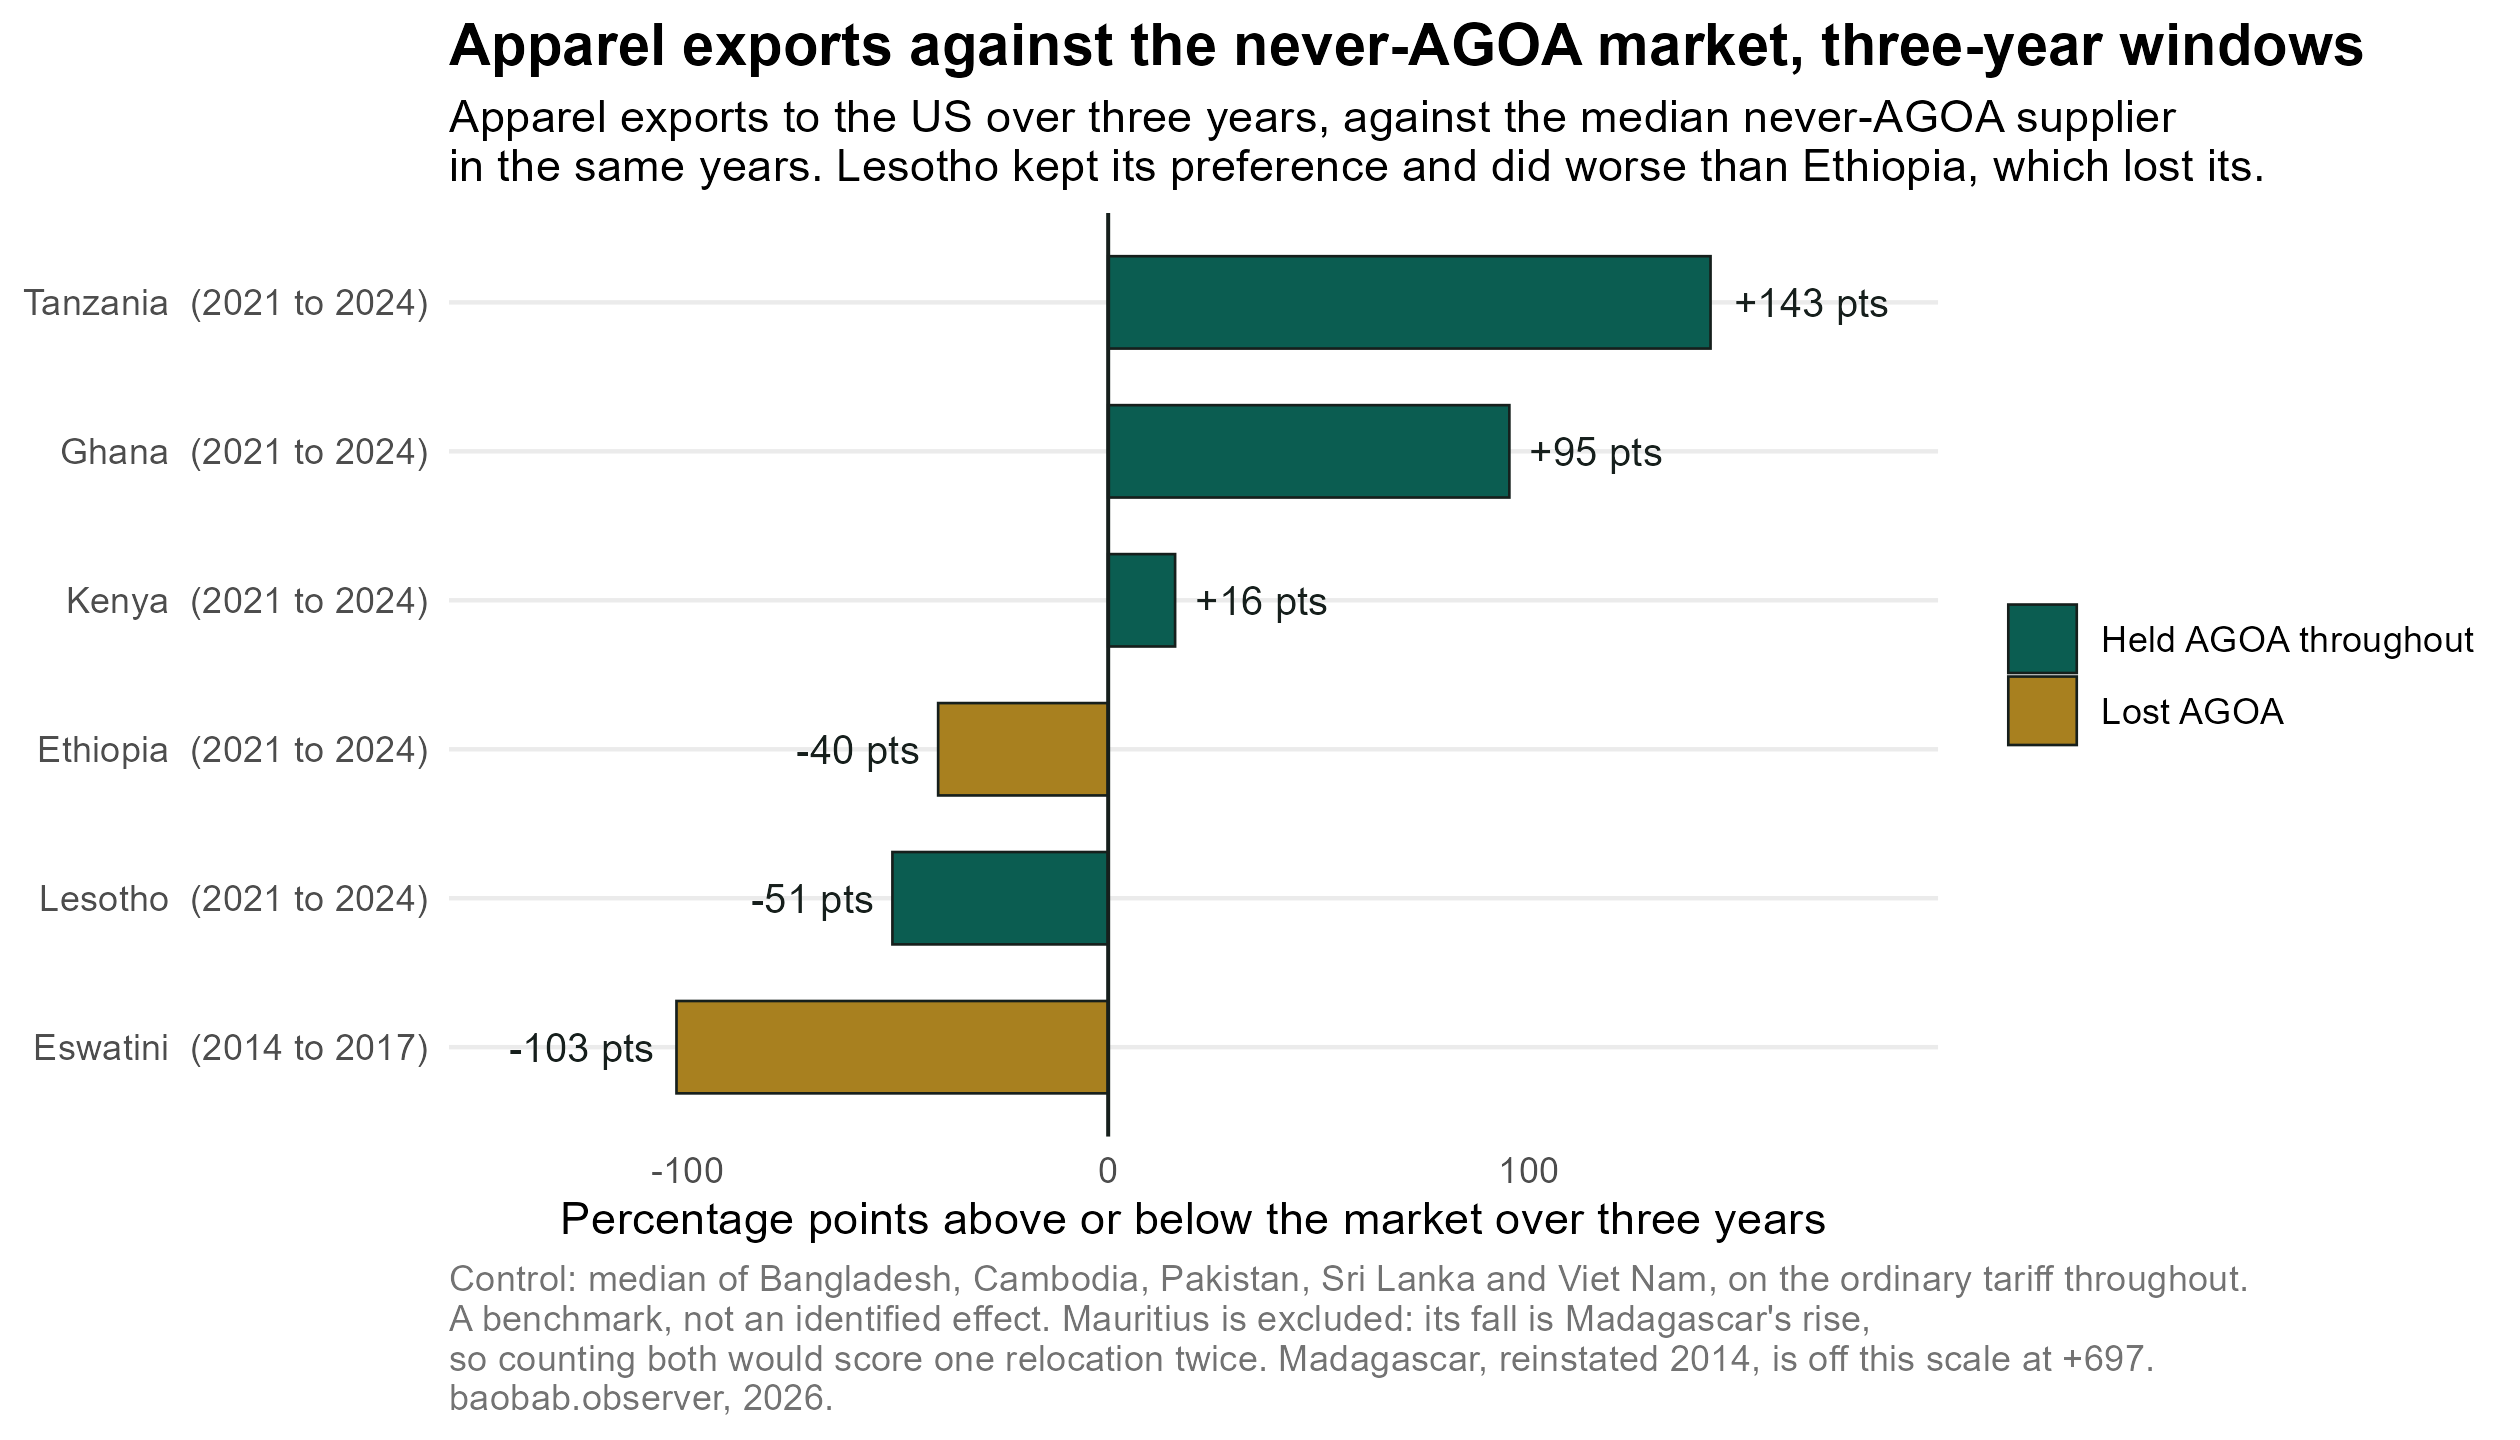
Lesotho held its preference throughout and finished fifty-one points below the market. Ethiopia was expelled and finished forty points below. Keeping AGOA and losing it produced the same result to within a rounding error, while Kenya, Ghana and Tanzania held the same preference and finished above it.
Mauritius is not on that chart, and the reason matters. It fell too, by forty-six points, but its production did not vanish. It moved to Madagascar, which is off the same scale at plus 697. Counting Mauritius as a failure and Madagascar as a success would score one relocation twice. Lesotho is the only economy here that kept the preference and collapsed without its output turning up anywhere.
Which tells you the preference was never what separated them.
This asymmetry should govern how the programme is discussed. AGOA is debated as though eligibility were a switch, and in the duty column that’s exactly what it is. In the factory it isn’t. A country that loses eligibility for four years and gets it back doesn’t get those four years back, because the buyer who moved to Cambodia signed a contract, and the plant that closed sold its machines.
What this does to the argument
Three things, and the third is the one I did not expect.
First, the diagnosis was right about most of what the hubs worked on, and wrong about the largest part of it by value. For cut flowers, crafts, speciality foods and the rest of the non-apparel schedule, take-up genuinely is the constraint, and a later essay measures how badly. For apparel, which was 60% of what AGOA was worth, the assistance was pushing on a door that stood open. The money was not wasted. It was aimed at the lines where the value wasn’t.
Second, AGOA’s failure to build industry cannot be blamed on us for not using it. Where there was an industry, we used it completely, and where there wasn’t, there was nothing to use. Whatever explains Lesotho’s halving is downstream of the preference being claimed, not upstream.
Third is permanence, and it is the one that should change what we ask for. The removals show that eligibility is not worth the duty you save in the year you hold it. It is worth the duty you won’t pay in the years you are planning for.
An exporter that claims a preference in full every year, as Lesotho did, can still be running an industry that is winding down. The decisions that determine whether we still have an industry in 2030 are being made against a statute that expires, and a review that can remove us from it.
We were efficient about the part we could control. That is worth something, and it is not what we were promised.
So what should we ask for instead? That is the question the first essay ended on, and the answer is not more time.
For twenty-five years the same preference ran over a motor industry in South Africa and a foreign-owned sewing enclave in Lesotho. What separated them was a rule South Africa once had and Lesotho was never given: to keep the benefit, make more of the thing here. AGOA’s apparel rule said the opposite, and we have just seen what it produced.
The workings are on the table as usual, wrong turns included. If you negotiate this, report on it or make things under it, and I have the picture wrong, say so.
Tell me what you see. The next essay lands on Wednesday.
Method note
Effective duty is calculated duty (CAL_DUT) as a percentage of consumption value (CON_VAL), from United States Census international trade data, over HS chapters 61 and 62, by calendar year. It is duty actually assessed at entry, so it reflects preferences claimed rather than preferences available. Produced by scripts 304_utilisation_panel.R and 312_essay04_figures.R from a vault pull made on 18 August 2026, with every figure’s numbers deposited as a CSV artefact beside it.
2025 duty rates are excluded from every comparison above, though trade values for 2025 are used where the text says so. That year the effective rate rose for every economy in the sample, beneficiary and non-beneficiary alike, because the IEEPA reciprocal tariffs and the Section 122 surcharge sit on top of the ordinary schedule. Lesotho went to 8.17%, Vietnam to 28.42%. That is a change in American tariff law, not in utilisation, and reading it as one would be an error.
Sources for the diagnosis, which are not mine. The Congressional Research Service formulation is from its AGOA product IF10149. The $1.6 billion trade capacity-building figure and the hub chronology come from USAID’s own archive and the programmes’ published records. The hubs opened in Gaborone, Nairobi and Accra from June 2002 and ran through several generations of contracts; the sector lists are from the hubs’ own factsheets. Implementing contractors are on the public record and are deliberately not named here, because the argument is about a premise held across two decades of programming rather than about any firm’s delivery of it.
The Census series begins in 2010, so Madagascar’s 2010 removal has no pre-period and the removal figure shows Ethiopia and Eswatini only. It stops two years after each event rather than three because Eswatini’s third year is when its eligibility returned. That reinstatement is not in the verified transition table this analysis uses.
The control, and what it is not. Where the essay puts a country so many points above or below the market, the market is the median of the five big Asian suppliers that never held AGOA: Bangladesh, Cambodia, Pakistan, Sri Lanka and Vietnam. They face the ordinary tariff throughout, so they carry world demand without carrying any eligibility change. Windows are three years each, so a one-year collapse is not set beside a six-year decline, and each gap is measured against its own period’s control. This is a benchmark and not an identified effect. There is no parallel-trends test, no matching and no inference, and it should not be read as one. It says what a country did relative to the market, which is all it claims.
The Lesotho employment figures are the Lesotho National Development Corporation’s, which counts jobs in the firms it assists rather than across the whole sector. LNDC’s own published figure for 2024 is 31,000 to 34,000. The 34,151 used here sits marginally above that range. The decline of roughly 16,000 over March 2018 to March 2024 is as reported by GroundUp and by Bird Story Agency rather than computed here, and is carried to corroborate an independently measured trade decline. LNDC’s own 2018 series has not been checked directly, so the six-year comparison is approximate.
The Nien Hsing closures are from GroundUp and Sourcing Journal: Glory International in 2022, then Nien Hsing International and C&Y Garments, leaving Formosa and Global International Garments. Formosa is the group’s textile mill rather than a garment plant, listed by Nien Hsing under textile facilities at Ha’Thetsane Industrial Area, Maseru, and its published factory profile reports spinning and weaving in Lesotho: about 1.3 million yards of denim and 900 tons of cotton yarn a month on roughly 900 staff, using African cotton, with most of its ring-spun yarn sold on to South Africa, Eswatini and Mauritius. This corrects an earlier version of this essay, which said Lesotho had “no spinning, no weaving and no dyeing” and that a plant there had “no mill down the road”. Both were wrong. Corrected 3 September 2026 after EWK asked whether the ownership claim held. Nien Hsing Textile is listed in Taiwan as TWSE 1451, and its annual reports would be the primary record. They have not been checked.
Eligibility comes from the study’s own AGOA country reference, not the trade file’s country groupings. Somalia, Sudan and Zimbabwe have never been eligible and are excluded throughout. Rwanda is eligible but has held no apparel benefits since 31 July 2018.
The change figure covers beneficiaries with at least $10 million in apparel trade in either endpoint year; below that, a percentage change is one consignment. Economies whose eligibility changed inside the window are excluded, which is why Ethiopia, up 44.9% across 2018 to 2024, does not appear: it lost AGOA in 2022, so its change has an obvious cause. That is a different window from the removal comparison above, which runs 2021 to 2024 and has Ethiopia forty points below the market. Both are true, and they are not the same measurement.
Sources. The diagnosis and the response. - Congressional Research Service, African Growth and Opportunity Act (AGOA), product IF10149. https://www.congress.gov/crs-product/IF10149
- US Department of Commerce, AGOA apparel eligibility and the special rule for lesser developed beneficiary countries. https://legacy.trade.gov/agoa/eligibility/apparel-eligibility.asp
Lesotho. - Lesotho National Development Corporation, textiles and garments sector. https://lndc.org.ls/textiles-garments/
- GroundUp, Mass lay-offs at Lesotho garment factories as US tariffs bite. https://groundup.org.za/article/mass-lay-offs-at-lesotho-garment-factories-as-us-tariffs-bite/
- GroundUp, Factory workers to march as Lesotho’s textile jobs hang by a thread. https://groundup.org.za/article/factory-workers-to-march-as-lesothos-textile-jobs-hang-by-a-thread/
- Bird Story Agency, Stitching Lesotho into the global economy. https://allafrica.com/stories/202607230472.html
- Sourcing Journal on Nien Hsing’s Lesotho operations. https://sourcingjournal.com/topics/labor/levis-wrangler-nien-hsing-textile-lesotho-garment-workers-union-coronavirus-296892/
Ethiopia. - The Reporter Ethiopia, on the National Bank of Ethiopia’s account of jobs and firms lost after the AGOA suspension. https://www.thereporterethiopia.com/43838/
- International Growth Centre, Lessons from Ethiopia’s AGOA suspension amidst US tariff uncertainty. https://www.theigc.org/blogs/ethiopia-agoa-suspension-us-tariffs
Eswatini. - tralac, on Eswatini’s AGOA exclusion, published under the country’s former name as Drawing lessons from Swaziland’s AGOA exclusion. https://www.tralac.org/discussions/article/5855-drawing-lessons-from-swaziland-s-agoa-exclusion.html
Kenya, Madagascar and the regional relocation. - Cornelia Staritz and Mike Morris, Local Embeddedness and Economic and Social Upgrading in Madagascar’s Export Apparel Industry. https://papers.ssrn.com/sol3/papers.cfm?abstract_id=2237506
- Lindsay Whitfield and Cornelia Staritz, Local supplier firms in Madagascar’s apparel export industry, Environment and Planning A, 2021. https://journals.sagepub.com/doi/10.1177/0308518X20961105
- Business Daily, Kenyan AGOA apparel earnings, 2024. https://www.businessdailyafrica.com/bd/economy/kenya-firms-earn-sh60bn-from-2024-agoa-exports-5031168
- Export Processing Zones Authority, Kenya, Annual Performance Report 2023. https://epzakenya.com/wp-content/uploads/2024/11/EPZ-Annual-Performance-Report-year-2023_popular-version.pdf
Figures are the author’s own, computed from United States Census international trade data and the United States Harmonized Tariff Schedule. baobab.observer, 2026.